Complex communication, clearly directed.

Creative direction and communication strategy for city builders and mission-driven organizations with complicated stories to tell.

Clients
Cherry Creek North BID·Vail Resorts·Downtown Denver Partnership·Downtown San Francisco·Metro Denver EDC·The Hollywood Partnership·Walk Denver·Shared-Use Mobility Center·Colfax Ave BID·PUMA·Denver Arts and Venues·Downtown Tulsa·RTD·Downtown Colorado, Inc.·Denver Startup Week·Fox Tuttle Hernandez Group·CU Boulder·Denver Water·Mapquest·Visa·Capital One·SendGrid·

I bring structure, visual intelligence, and creative direction to complex communication challenges. The result is not just a finished deliverable, but a connected system designed to help people understand, engage, and act.

Clarity is the creative strategy.

Capabilities

Reports and
digital publications

Annual reports, impact reports, executive summaries, and the digital experiences that carry them.

Information and
communication design

Infographics, data visualization, diagrams, and maps that make complicated information easy to follow.

Brand and
creative direction

Brand identities, campaign systems, and messaging frameworks that stay consistent across every channel.

Case studies

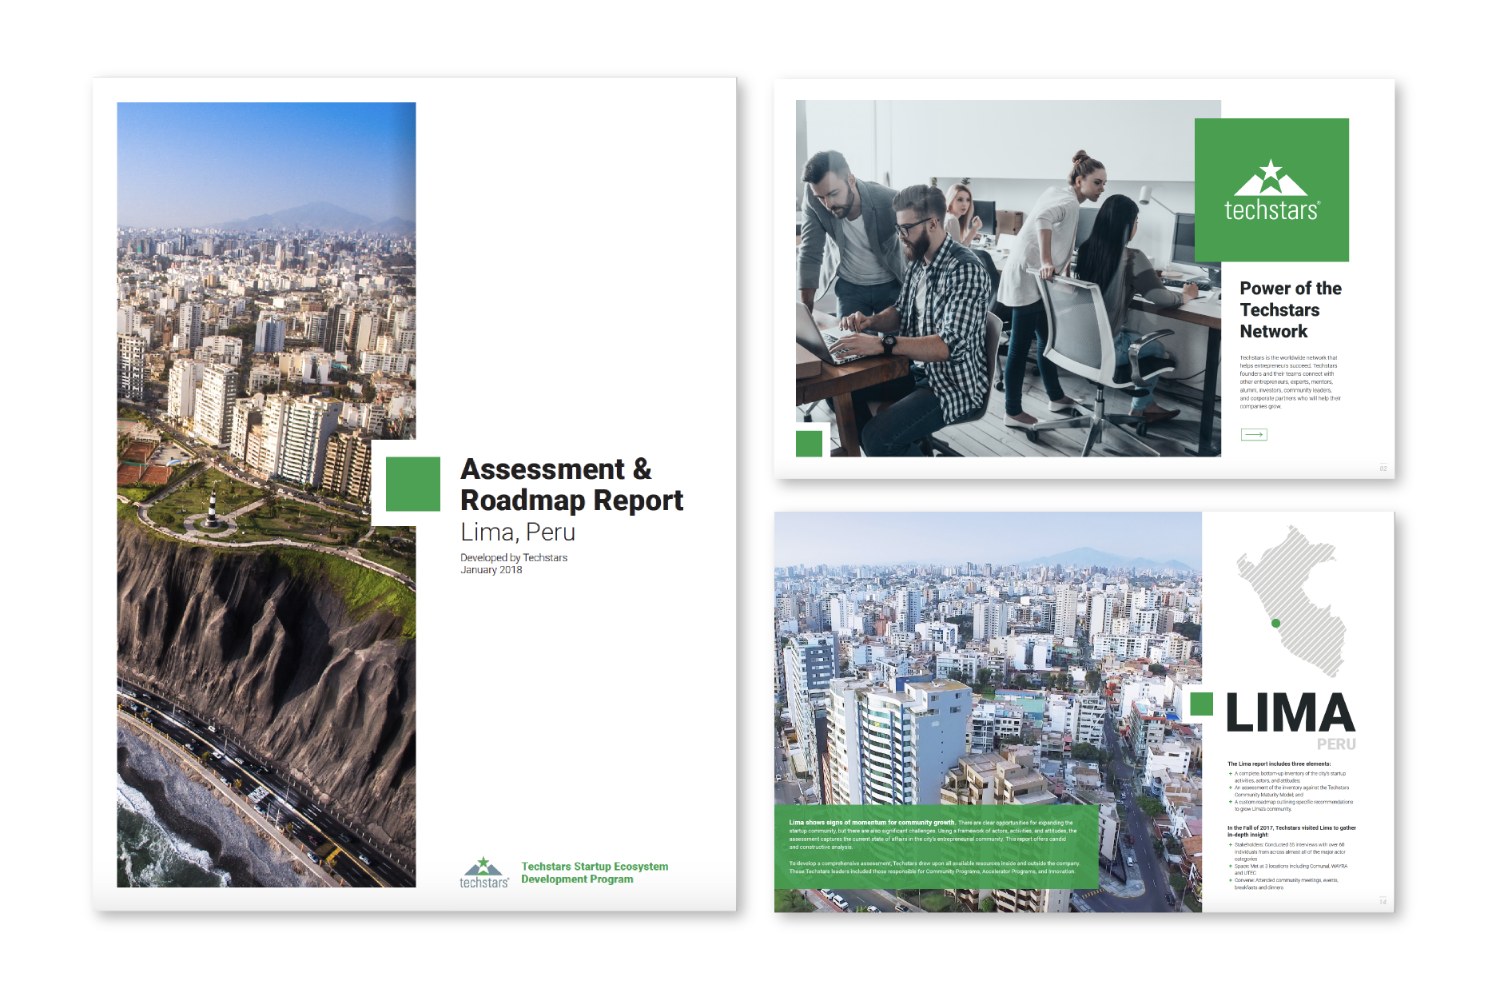
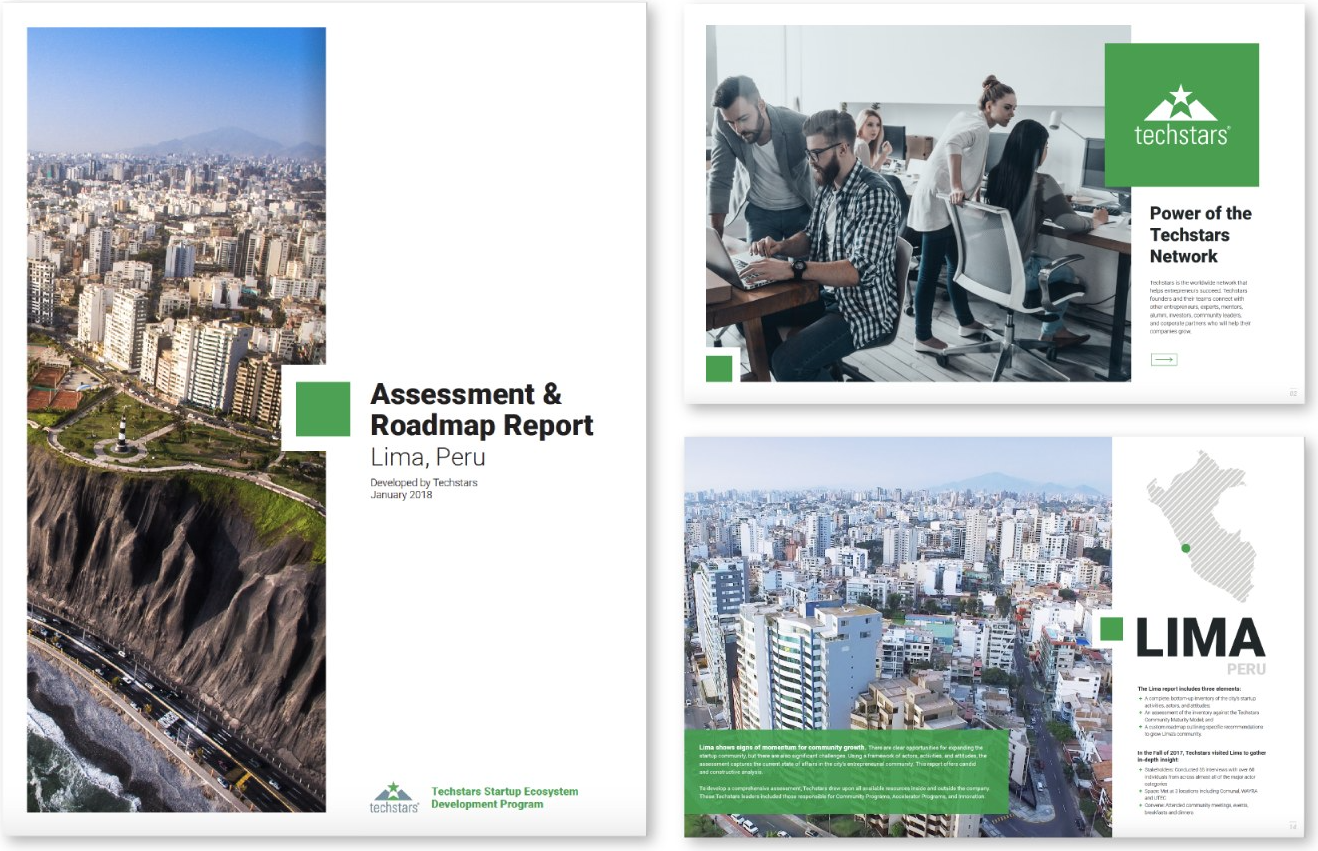
Techstars Assessment and Roadmap Report, cover and interior spreads
Multi-channel report system  ·  Techstars

A city technology scorecard, built for print and screen

Developed for Techstars, this strategic report evaluates cities across a range of digital technology indicators to identify competitive strengths, infrastructure gaps, and areas of opportunity.

The project expanded from a traditional written report into one connected release: a printed report, a landing page that lets readers compare cities themselves, and a social campaign built from the same visual system.

View the full report
Deliverables
Printed report, digital experience, information design, social motion
Outcome
Comparisons readable at a glance, city by city
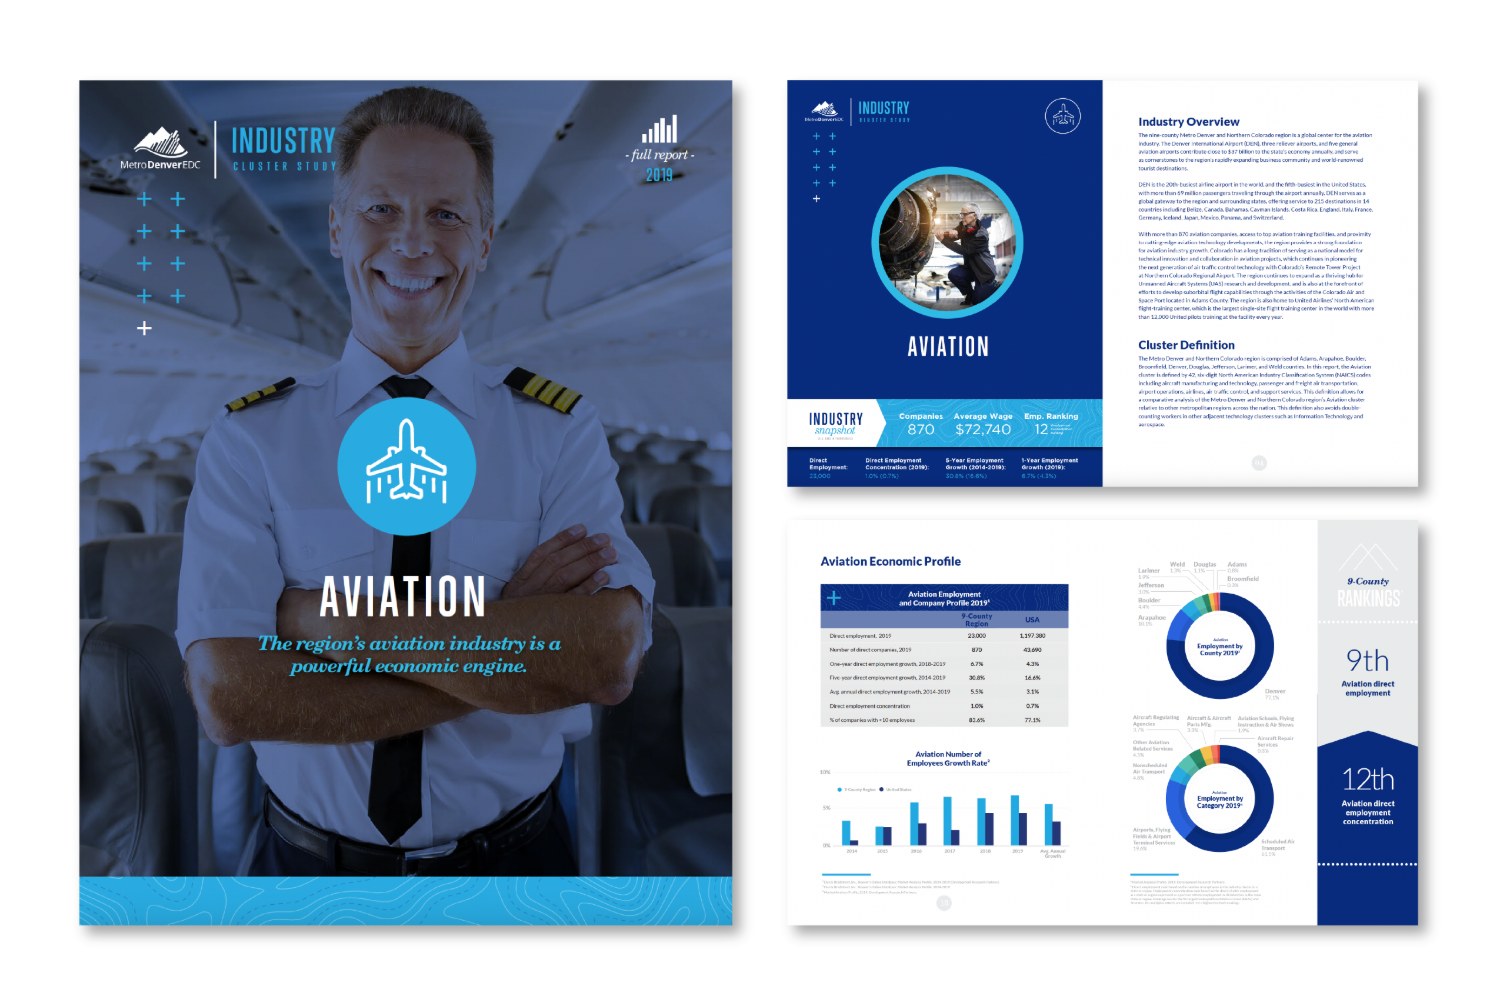
Metro Denver EDC Industry Cluster Study, the aviation report with sector covers
Report system  ·  Metro Denver EDC

Nine industry sectors, one repeatable report system

The Metro Denver Economic Development Corporation reviews nine industry clusters, from aviation to bioscience to financial services, each one a full report of its own. The work needed to hold together as a family while giving every sector its own voice.

I built a template system with a shared grid, icon set, and color logic, then designed an executive quick-scan for each sector so readers could take in the key findings in two pages, or dive into the broader 25-page document.

View the full report
Deliverables
Nine full reports, nine executive cluster scans, sector identity and template system
Outcome
One recognizable series, produced year after year
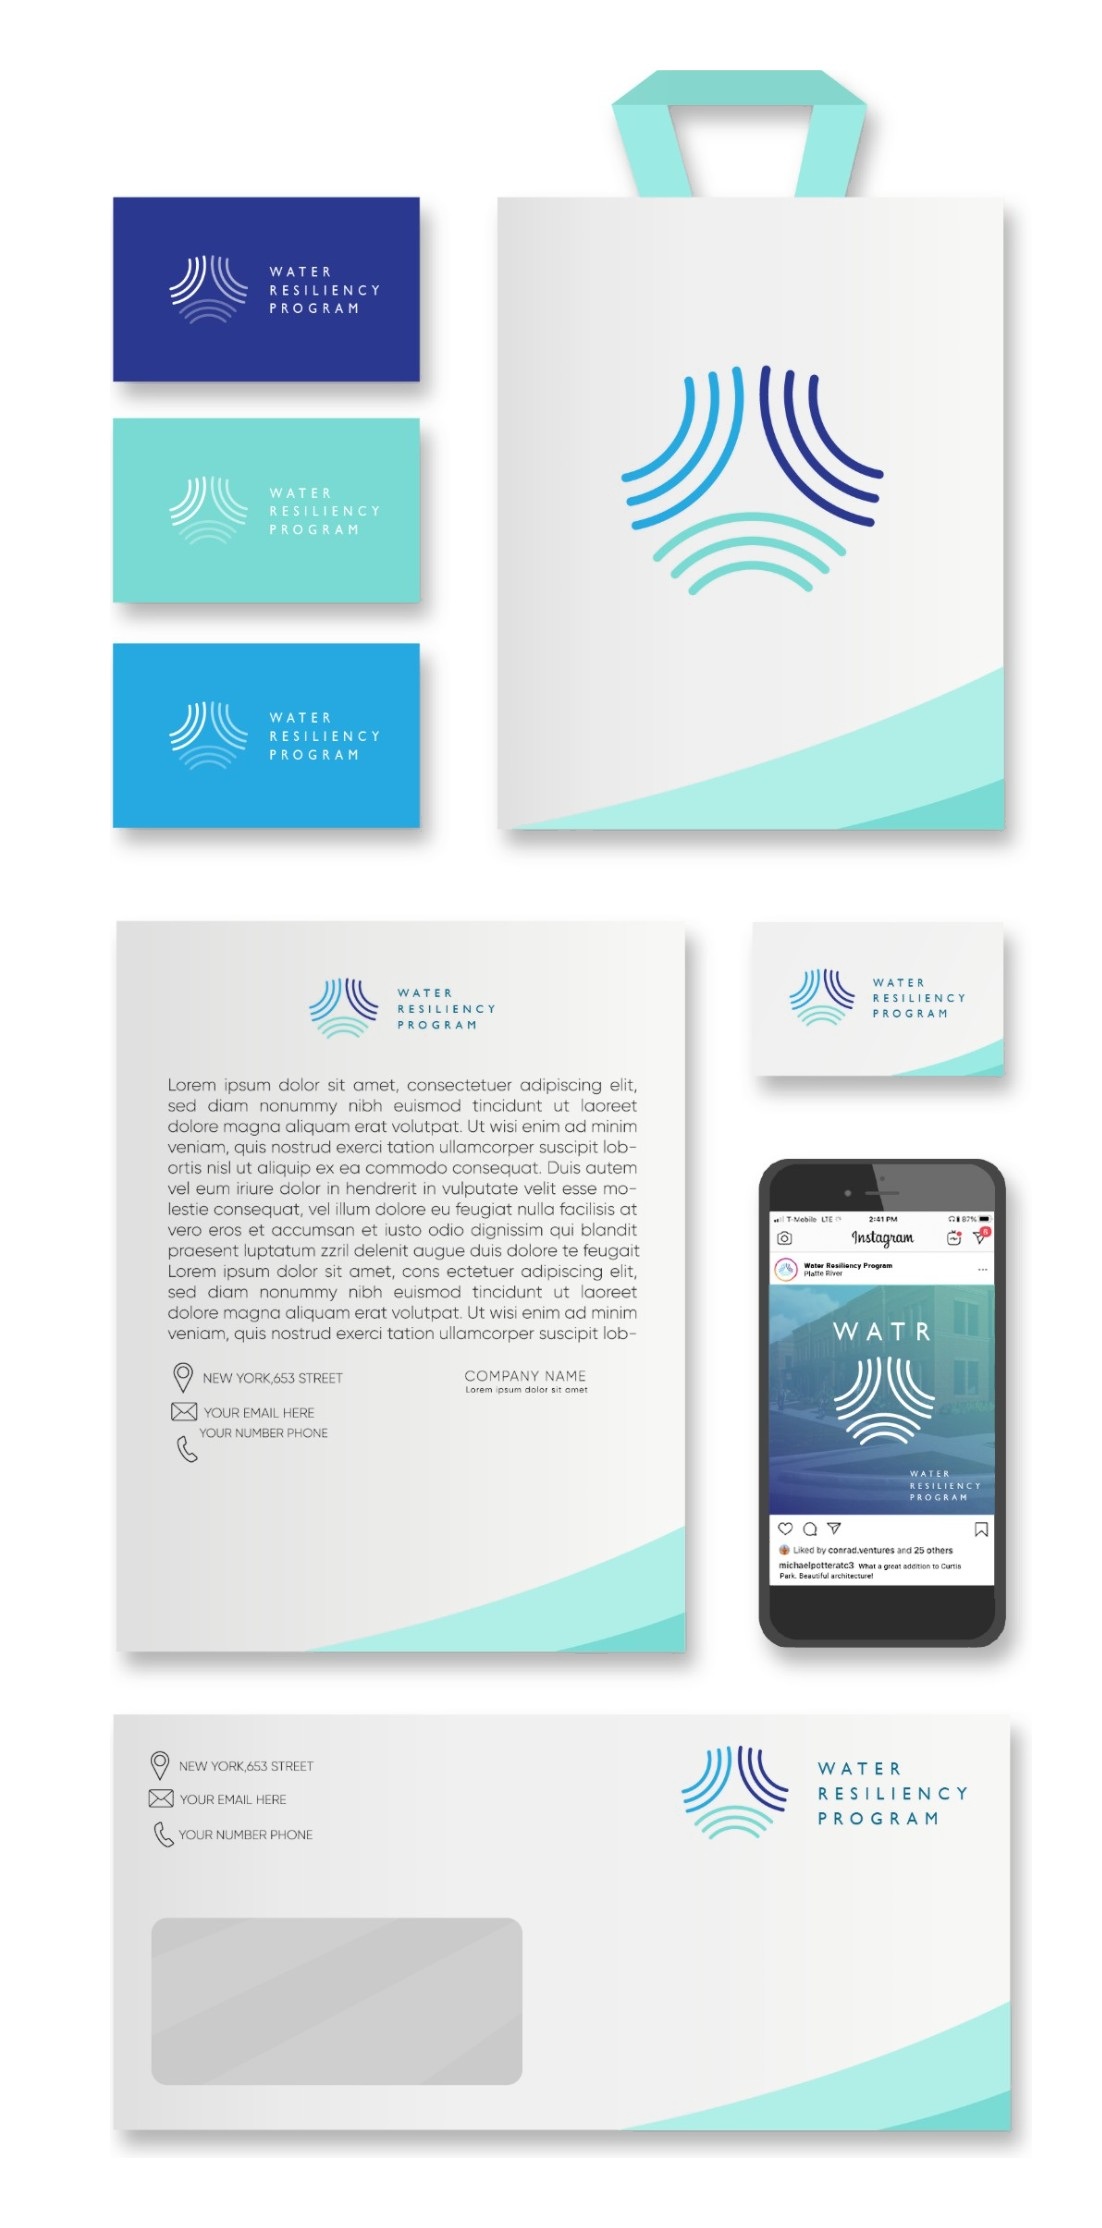
Water Resiliency Program brand collateral: business cards, tote, letterhead, envelope and social post
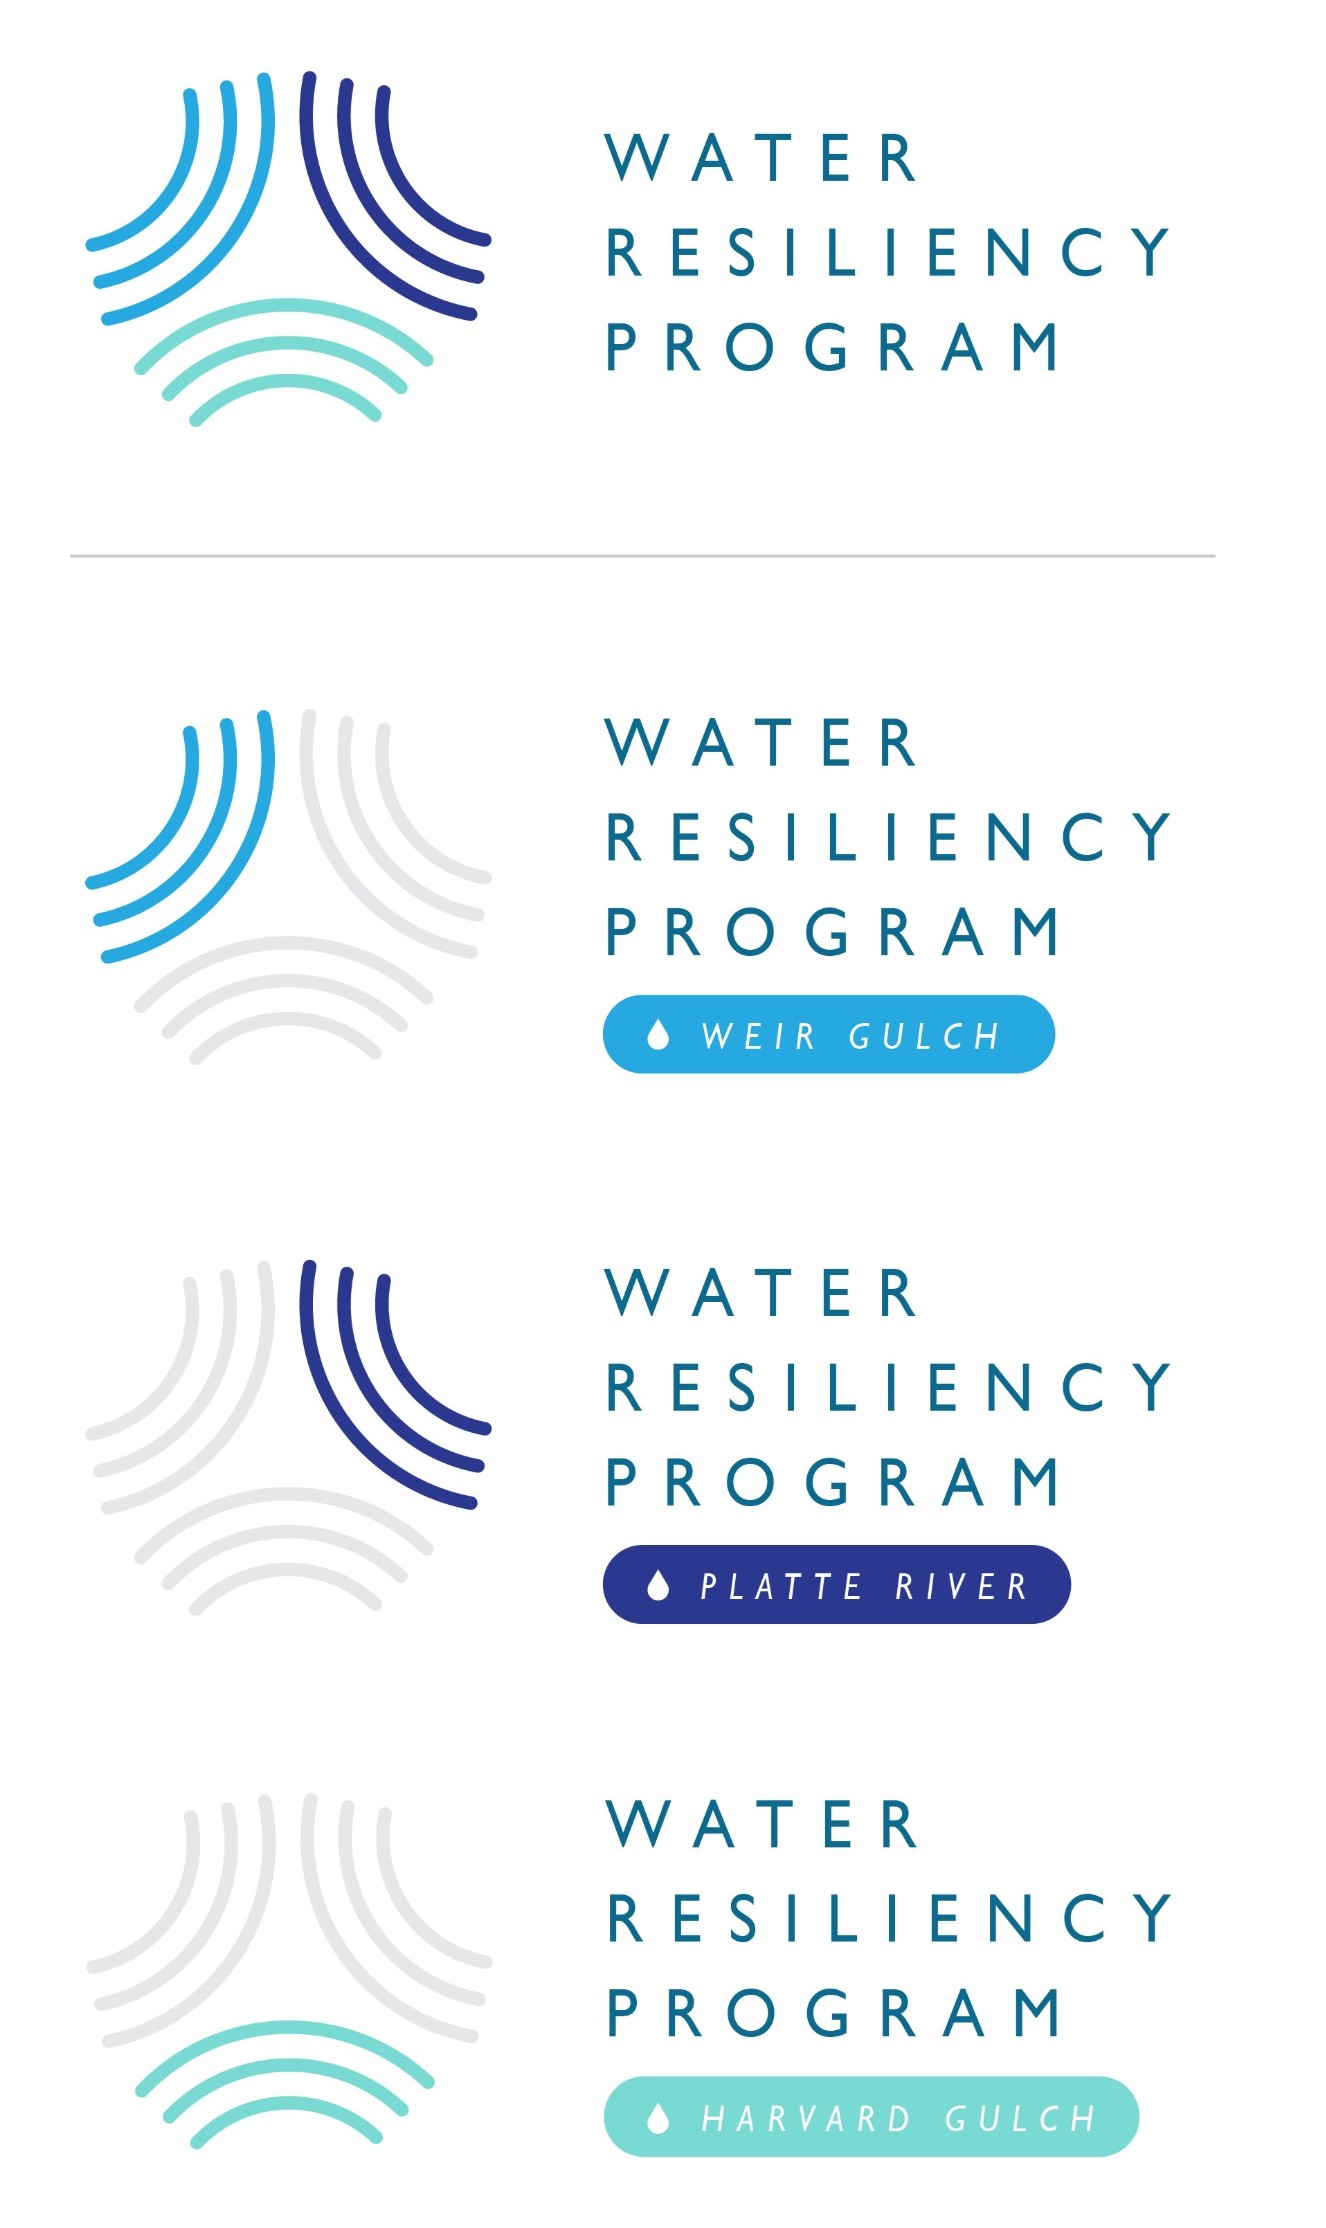
Water Resiliency Program master mark with Weir Gulch, Platte River and Harvard Gulch sub-brand lockups
Brand system  ·  City of Denver

One identity for three watersheds, and a sub-brand for each

For the Denver Water Resiliency Program, the challenge was not simply creating a logo. The brand needed to represent all three Denver tributaries in one take, while also breaking apart into individual sub-brands for each watershed.

That led to a flexible identity system that could unify the program while giving each project an individual, but related, identity.

Deliverables
Program identity, three watershed lockups, print collateral, social and signage system
Outcome
Each project reads as its own, and as part of one program
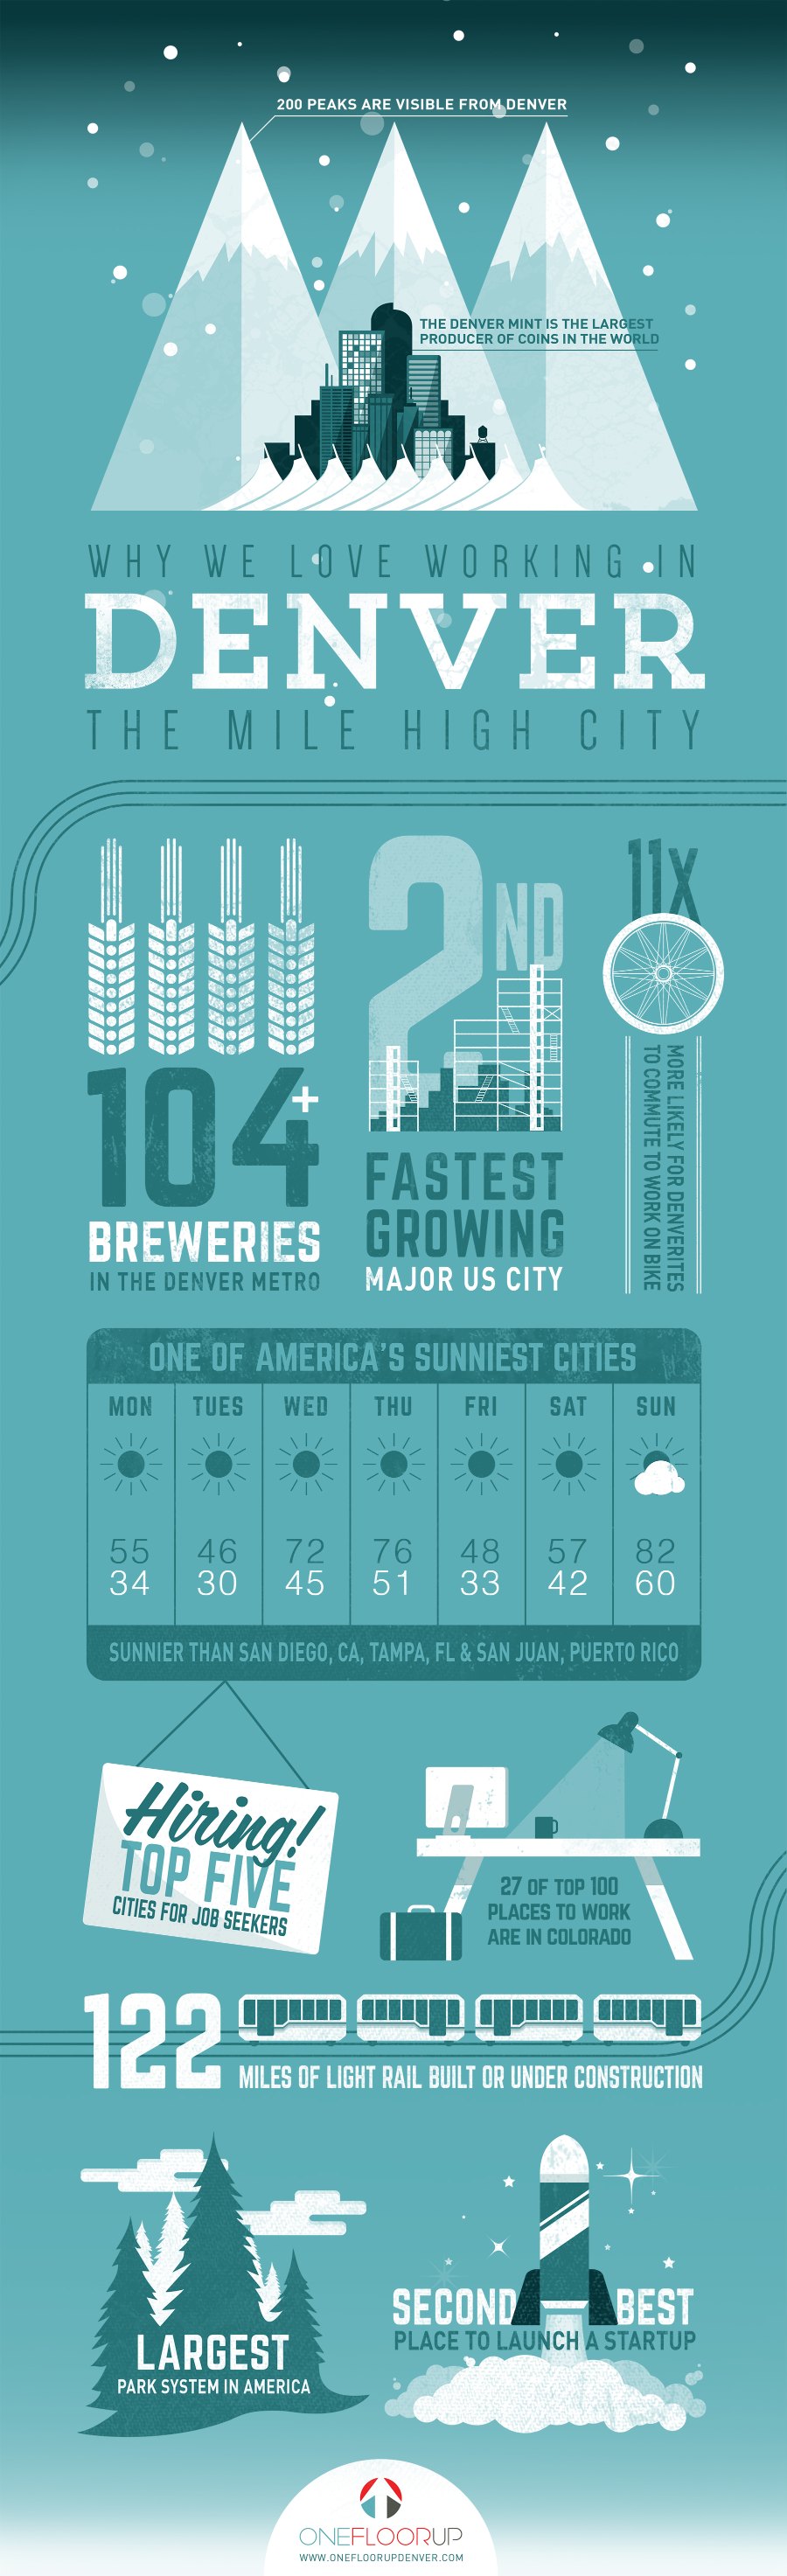
Why we love working in Denver, the full infographic
Infographic  ·  One Floor Up

A city's boom years, captured in a single infographic

One Floor Up wanted to capture what made Denver worth moving to during its fastest growth years. The case was not economic data alone, it was quality of life, and that is a harder thing to chart.

The source material arrived as pages of research. I cut it to the handful of facts that actually landed, then built an illustrated system around them, mountains, rail lines, and light, so the graphic feels like the city it is describing rather than a chart about it.

Deliverables
Long-form infographic, custom illustration system, social and web crops
Outcome
Pages of research reduced to one graphic people wanted to share

How I work

01

Diagnose

Review the raw material, gather stakeholder input, and identify what others may have missed.

02

Distill

Reduce the noise and make the central takeaway impossible to miss.

03

Build

Create a consistent visual language that gives the content structure and direction.

04

Impact

Deliver reports, brands, and campaigns that people understand, remember, and act on.

Derek Berardi

About

Derek Berardi is a creative director and communication strategist specializing in complex information, editorial systems, and visual storytelling. He works with organizations to transform dense content and ambitious ideas into communication that is clear, cohesive, and engaging.

Creative directionCommunication strategy
Editorial and report systemsInformation design
Brand and campaign systemsDigital experience

Have something important and complicated to communicate?

Start a conversation derek.berardi@gmail.com